Highest Cesium-137 Level in Nearly a Month for N. California Raw Milk
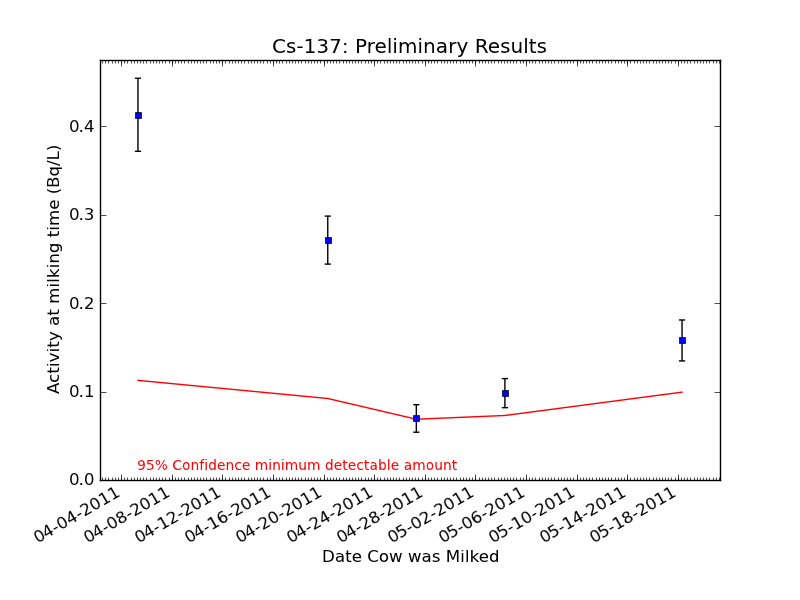
The following are results for milk samples obtained from a few Bay Area dairies specializing in “raw” milk — that is, milk that is “straight from the cow.” The advantage of these samples is that we know from the farmers exactly how much grass the cows have been consuming, and we have even obtained some grass samples from the same fields that the cows graze. For one dairy in Sonoma County, we have received several samples and so have created plots and a table of the data. We have single samples from two other dairies, displayed in a table at the bottom of the page.
5/24/2011: Major revision note: Our first measurements of raw milk had been reported with levels of I-131 that were much higher than store-bought milk. The root of the problem was that our analysis code accidentally over-corrected for the decay of I-131 in raw milk, and so the activity reported for I-131 was about 5 times too high. We have revised the code to report the correct activity.
In the table below, we are providing two numbers for each of the isotopes. The first is a standard concentration unit of Becquerel per liter (Bq/L) which describes the number of particles decaying over the period of one second. For the general public, we have converted this number to an exposure dose per liter of milk consumed. The number in parentheses is the number of liters of milk that one would need to consume to equal the radiation exposure of a single round trip flight from San Francisco to Washington D.C. (0.05 mSv). For more information on how this equivalent dose is calculated, the details are here: How Effective Dose is Calculated
In the table, MDA stands for Minimum Detectable Activity. This is the lowest level of measurement where we can confidently report results. To find out more about how the MDA is calculated, please visit How we calculate MDA.
All raw milk measurements are performed with a mechanically-cooled germanium detector on loan from ORTEC and AMETEK.
Raw Milk: Dairy in Sonoma County
Raw Milk: Dairy in Sonoma County
| Collection Date | I131 | I132 | Cs134 | Cs137 | Te132 | Data |
|---|---|---|---|---|---|---|
| Bq/L (liters**) | Bq/L (liters**) | Bq/L (liters**) | Bq/L (liters**) | Bq/L (liters**) | ||
| 04/05/2011 | 0.61±0.06 [MDA=0.12] (4.4e+03) |
0.19±0.03 [MDA=0.14] (1.4e+06) |
0.48±0.05 [MDA=0.10] (5.0e+03) |
0.41±0.04 [MDA=0.11] (6.5e+03) |
less than MDA [MDA=0.09] |
data |
| 04/20/2011 | 0.17±0.02 [MDA=0.10] (1.6e+04) |
less than MDA [MDA=0.11] |
0.18±0.02 [MDA=0.07] (1.3e+04) |
0.27±0.03 [MDA=0.09] (1.0e+04) |
less than MDA [MDA=0.06] |
data |
| 04/27/2011 | less than MDA [MDA=0.07] |
less than MDA [MDA=0.14] |
0.13±0.02 [MDA=0.10] (1.9e+04) |
0.07±0.02 [MDA=0.07] (3.9e+04) |
less than MDA [MDA=0.08] |
data |
| 05/04/2011 | less than MDA [MDA=0.10] |
0.97±0.20 [MDA=0.88] (2.8e+05) |
0.11±0.02 [MDA=0.07] (2.2e+04) |
0.10±0.02 [MDA=0.07] (2.7e+04) |
less than MDA [MDA=0.37] |
data |
| 05/18/2011 | less than MDA [MDA=0.07] |
less than MDA [MDA=0.31] |
less than MDA [MDA=0.08] |
0.16±0.02 [MDA=0.10] (1.7e+04) |
less than MDA [MDA=0.08] |
data |
Raw Milk: Two Other Dairies
| Collection Date | I131 | I132 | Cs134 | Cs137 | Te132 | Data |
|---|---|---|---|---|---|---|
| Bq/L (liters**) | Bq/L (liters**) | Bq/L (liters**) | Bq/L (liters**) | Bq/L (liters**) | ||
| 04/06/2011 | 0.31±0.03 [MDA=0.11] (8.7e+03) |
less than MDA [MDA=0.39] |
0.41±0.04 [MDA=0.09] (5.9e+03) |
0.49±0.05 [MDA=0.11] (5.5e+03) |
less than MDA [MDA=0.12] |
data |
| 04/27/2011 | less than MDA [MDA=0.09] |
less than MDA [MDA=0.11] |
0.19±0.02 [MDA=0.09] (1.3e+04) |
0.19±0.02 [MDA=0.10] (1.4e+04) |
less than MDA [MDA=0.07] |
data |
** The number in parentheses is the number of liters of milk that one would need to consume to equal the radiation exposure of a single round trip flight from San Francisco to Washington D.C. (0.05 mSv). To see how we calculate these numbers, please visit our explanation of the equivalent dose calculation.
source http://www.nuc.berkeley.edu
Short URL: http://www.myweathertech.com/?p=1525

